
A while back I stumbled upon the Engineering Ladders project by Jorge Fioranelli, a thoughtful, open-source framework for defining what different levels look like for engineers, tech leads, and beyond. It breaks down roles into clear expectations: scope, influence, technical depth, people impact, and more.It’s an awesome resource for teams, but when I tried to apply it to myself I wanted to fiddle
Why I Really Like This
One thing I see a lot — especially in interviews — is people saying “I’m a senior engineer.” But what does that actually mean? It’s definitely not just about coding for a certain number of years. Seniority shows up in what you own, how you influence, how you help others grow, and how far your impact goes. It’s way clearer to break that down than to just stick a label on someone.
I really like this tool because it makes that discussion practical. Instead of arguing about titles, I can ask a candidate to map their ladder:
- How do you see yourself in Technology, System, People, Process, and Influence?
- What examples back that up?
- Where do you want to grow next?
This is so much better than just saying “You’re senior” or “You’re junior.” It turns vague self-labels into a concrete map of skills and impact, for candidates and for ourselves.
- A senior candidate can sketch their own chart before an interview.
- You can compare self-assessments with your team’s expectations.
- Or just help someone reflect: Where am I strong? Where do I want to grow next?
My Own Snapshot
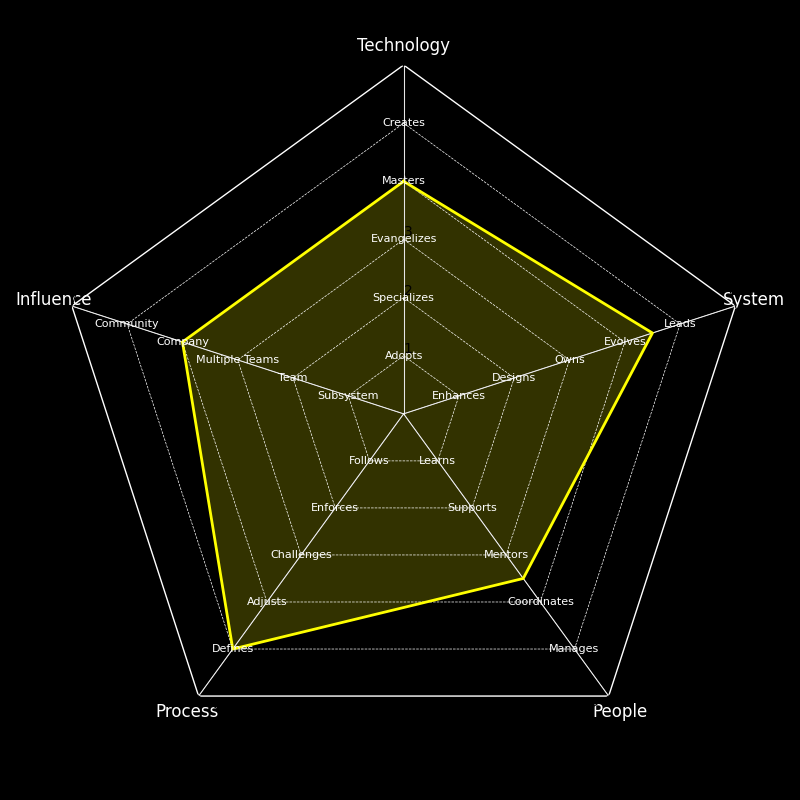
When I ran my self-assessment, my radar landed around Masters on Technology, Leads on System, Coordinates on People, Defines on Process, and Multiple Teams → Company on Influence. Visualizing it this way immediately showed me:
- Where I’m leaning more into org-wide impact.
- Where I could expand (e.g., mentoring other leads, not just engineers).
- And where my growth edges are next.
It’s way more motivating than reading a wall of text!
The Nerd in Me
For years, I’ve talked through these ladders verbally, in 1:1s, interviews, or mentoring sessions. But I always wanted an automated way to generate these diagrams interactively.
Thanks to modern Python tooling (and a bit of AI help), this is easier than ever. I built a simple Python client for generating Engineering Ladder radar charts, it’s free and open source on my repo: engineering-ladder-assessment on GitHub
I honestly don’t know if there’s already something exactly like this out there, I just did it because it was fun, useful for me, and maybe useful for you too.
🚀 Try It Yourself
Give it a try, whether you want to map your own growth or assess candidates more meaningfully. Let it help you on your journey, and see what insights come up. Give it a shot, I’m sure you won’t be disappointed!